Hello,
I am interested in generating the same image as is https://www.bonvinlab.org/education/HADDOCK24/HADDOCK24-protein-DNA-advanced/PyMol.jpg so I would like to generate the same image according to tutorial first, then generate image for my own transcriptional factor docking DNA. I use Haddock3 and I already run Haddock3 for my own protein/dna sequence so I have some .pdbs on output. At first in an advanced tutorial for Haddock2.4 /education/HADDOCK24/HADDOCK24-protein-DNA-advanced/ I found a PyMol plugin named ../tools/AIRviewer.py so I jumped directly to heading Using the PyMol plugin to create the AIR file (I hope I could skip first parts of tutorial), I tried to download fixed tool for Python3 from link in this topic Problem about Airviewer in Pymol (I had to add r because python3 in row 801: splitter1 = re.compile(r'\(|\)'); startassign = False) and run commands according to the tutorial and attached screenshot but after that, output does not look like the same as in tutorial. I also had to move to the folder 3CR0/part_3 file ambig_pm.tbl taken in sibling folder part_3-arch. It was not mentioned in that part of tutorial so I guess the tutorial is one chain?
Thank you
Hi there,
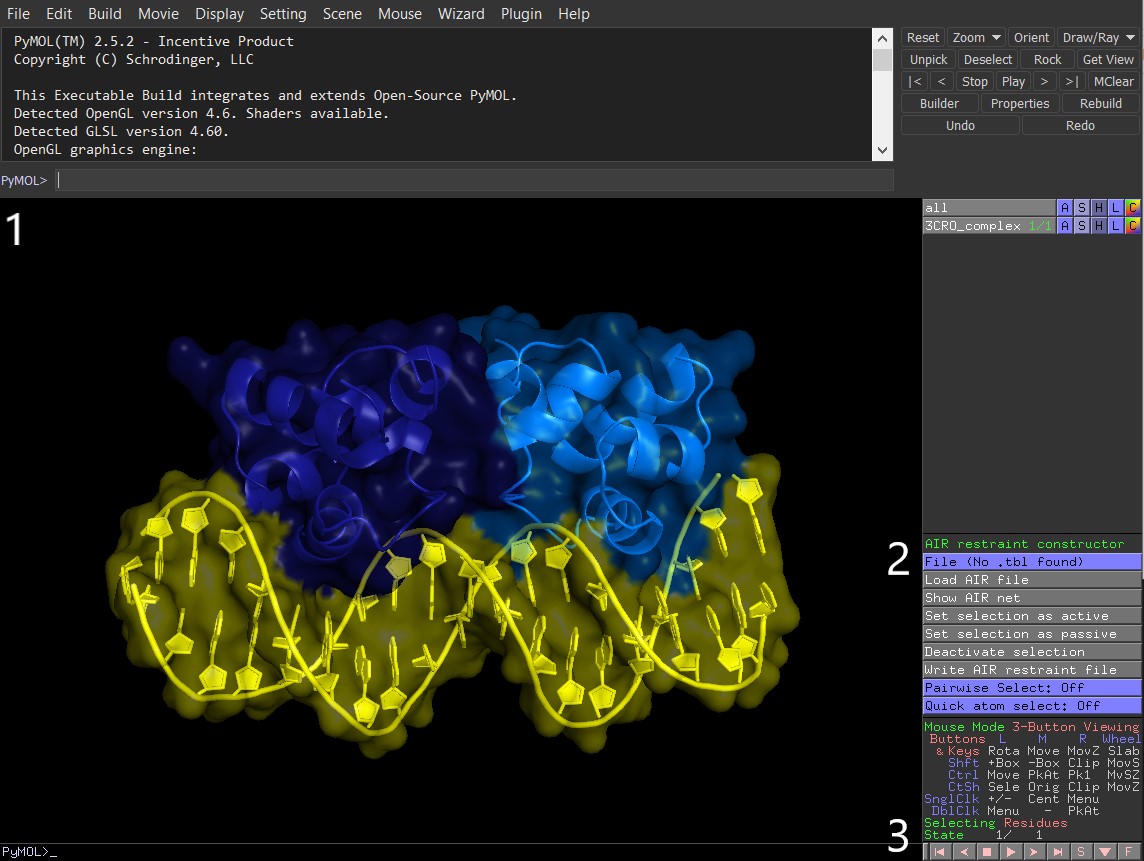
To achieve such visuals, one does not need AIRviewer. It can be achieved simply by showing molecules as surface and setting transparency value accordingly.
To recreate the image you linked, first colour the chains in your favourite colours, then:
show cartoon
set cartoon_ring_finder, 3
show surface
set transparency, 0.5
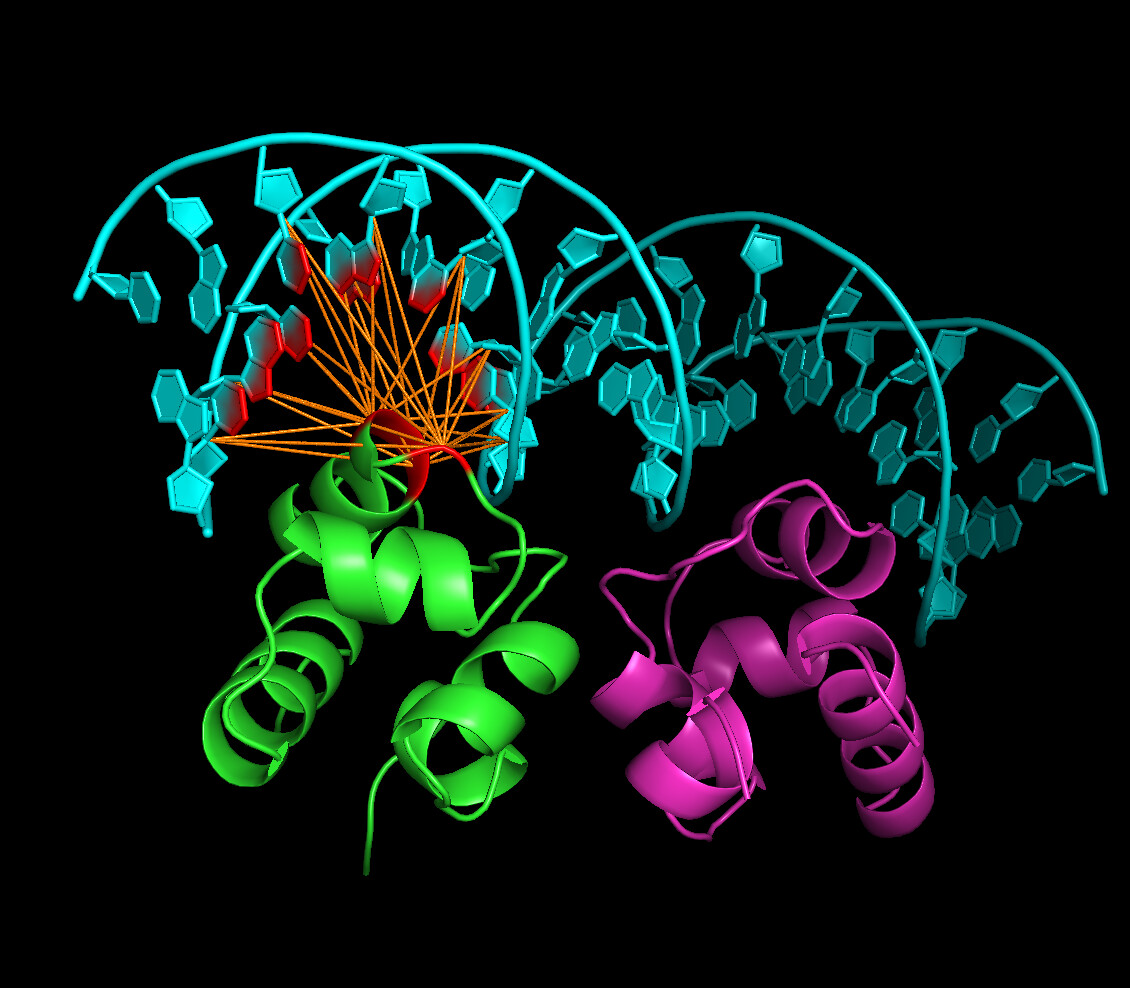
As for the AIRviewer, it can display AIRs, etc., like so:
Latest version is available here
I downloaded the latest version and I did:
$ pymol run/10_seletopclusts/cluster_1_model_1.pdb.gz
PyMOL>run AIRviewer3.py
# I see now AIR restraint constructor panel but it displays: No .tbl found
Which .tbl file should I load? From input config:
ambig_fname = "ambig_restraints.tbl"
unambig_fname = "unambig_restraints.tbl"
Or from the run directory run/data/07_emref/custom_ambig_restraints_fixed.tbl?
Thank you
If you want to load an existing tbl file, the easiest way is to start pymol from the same folder where your tbl file(s) are located. In this case, AIRviewer will automatically load each .tbl, and you’ll be able to switch between them.
For this, select the file of interest in the “File" field (in pymol, “AIR restraint constructor"), then click “Load AIR file” to display active/passive residues in red/green, respectively. Repeat the same process for other .tbl you’d like to see.
A small tip - reset the molecules’ colours before clicking “Load AIR file” for the next tbl. Otherwise, PyMOL will overlay the new active/passive colours on top of the existing ones, i.e. both old and new actives will be shown in red - most likely not what you want.
